IB BUsiness MAnagement:
|

|
Key Learning Outcomes:
|

The cost of holding stock is 4-10% of the stock's value
|
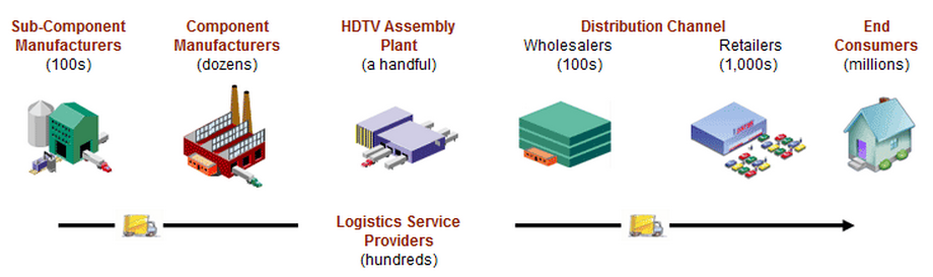
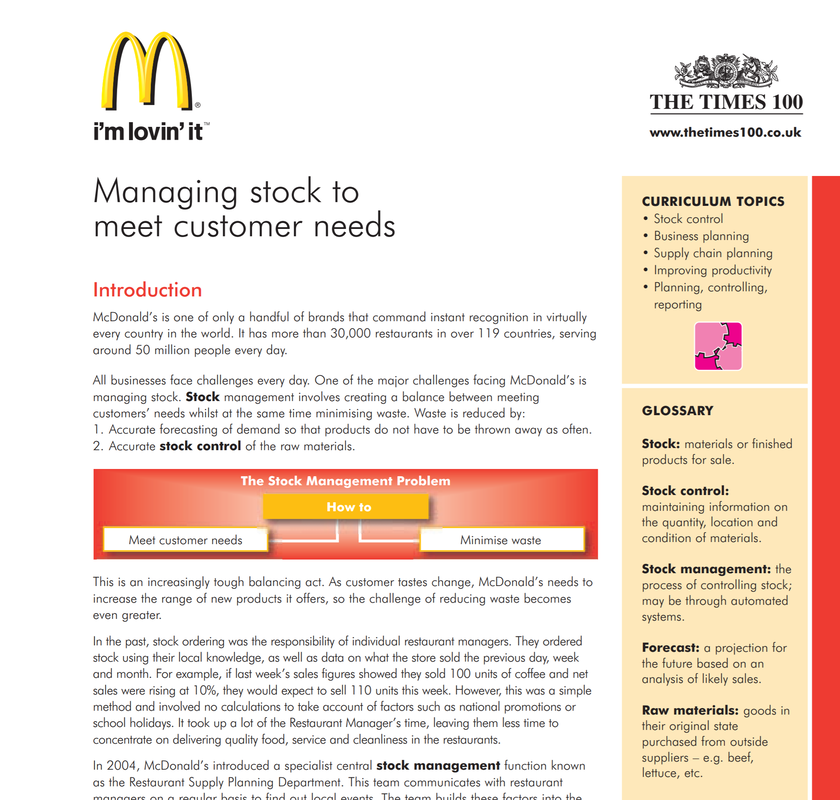
The Supply Chain ProcessA supply chain is a system of organisations, people, activities, information, and resources involved in moving a product or service from supplier to customer. Supply chain activities transform natural resources, raw materials, and components into a finished product that is delivered to the end customer.
Think back to your last visit to a Best Buy. Remember the large range of HD TVs, how did they all get there? The answer is the supply chain. Supply chains include all of the companies that participate in the design, assembly, and delivery of products for buyers like you. Retailers, manufacturers, transportation companies, and distributors are some of the key players. |
Managing supply chains |
Buy itMove it |
Make itSell it |
Stock ControlStock (inventory) materials and goods required to allow for the production of and supply of products to the customer.
Stock has three forms:

|
costs of stock holding:
|
not holding enough stock
|
Key TermsEconomic order quantity (EOQ): The optimum or least-cost quantity of stock to re-order taking into account delivery costs and stock-holding costs
Buffer stocks: The minimum stocks that should be held to ensure that production could still take place should a delay in delivery occur or production rates increase. Re-order quantity: The number of units or quantity (e.g. tonnes) ordered each time. Lead time: The normal time taken between ordering new stocks and their delivery. Re-order stock level: The level of stocks that will trigger a new order to be sent to the supplier. Just in case (JIC): Holding high stock levels ‘just in case’ there is a production problem or an unexpected upsurge in demand. Just in time (JIT): A stock control method that aims to avoid holding stocks by requiring supplies to arrive just as they are needed in production and completed products are produced to order. |
Just In Time stock control
Just In Time (JIT) requires that no buffer stocks are held, components arrive just as they are needed on the production line and finished goods are delivered to customers as soon as they are completed.
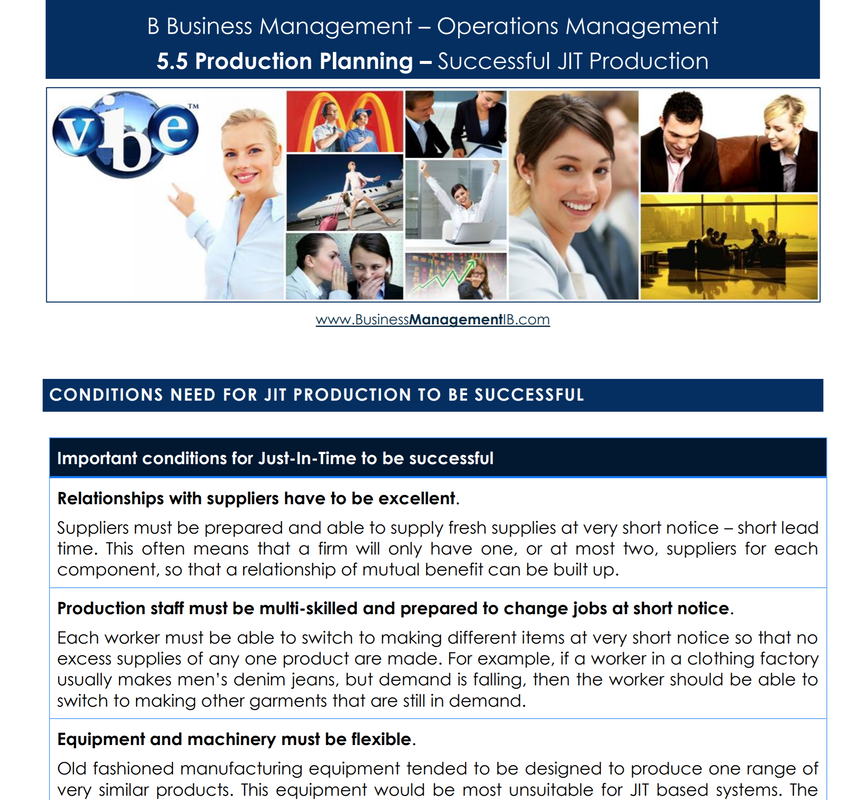
JIT - Conditions for success:
|
Advantages and disadvantages of just-in-time stock management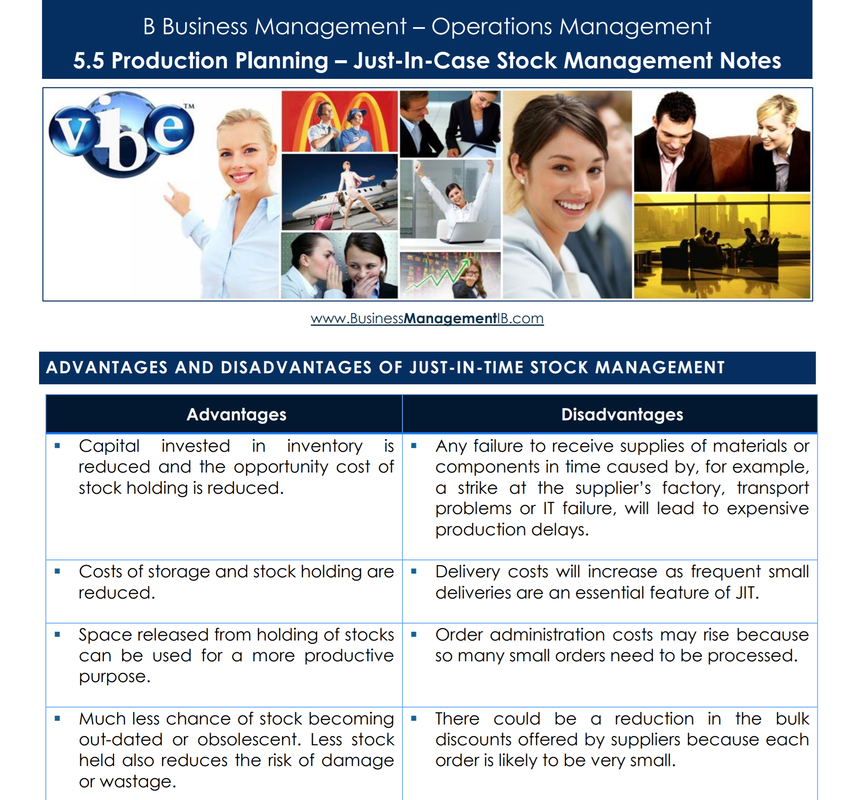

JIT may not be suitable for all firms at all times:
|


Just in time in practice |
Technology in managing stocks |
JUst-in-Case Stock controlJust In Case: The traditional view of holding stock was to hold high stock levels, especially of raw materials and finished goods, to meet unexpected situations such as:
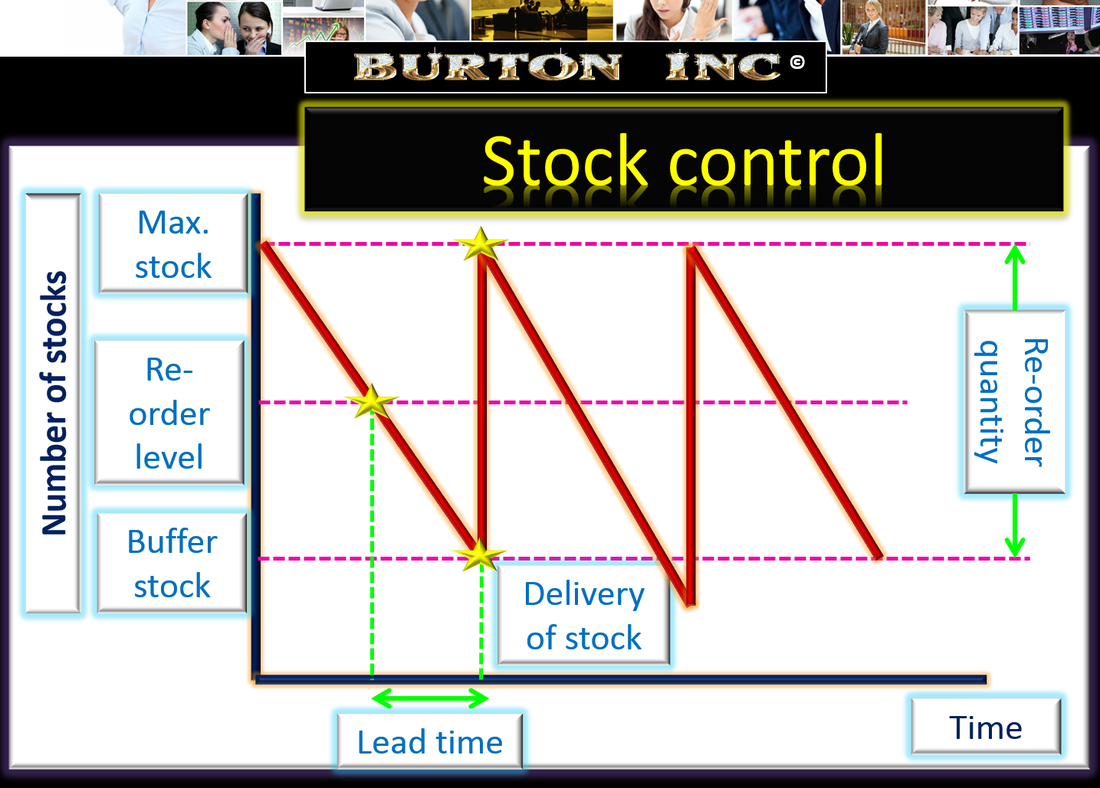
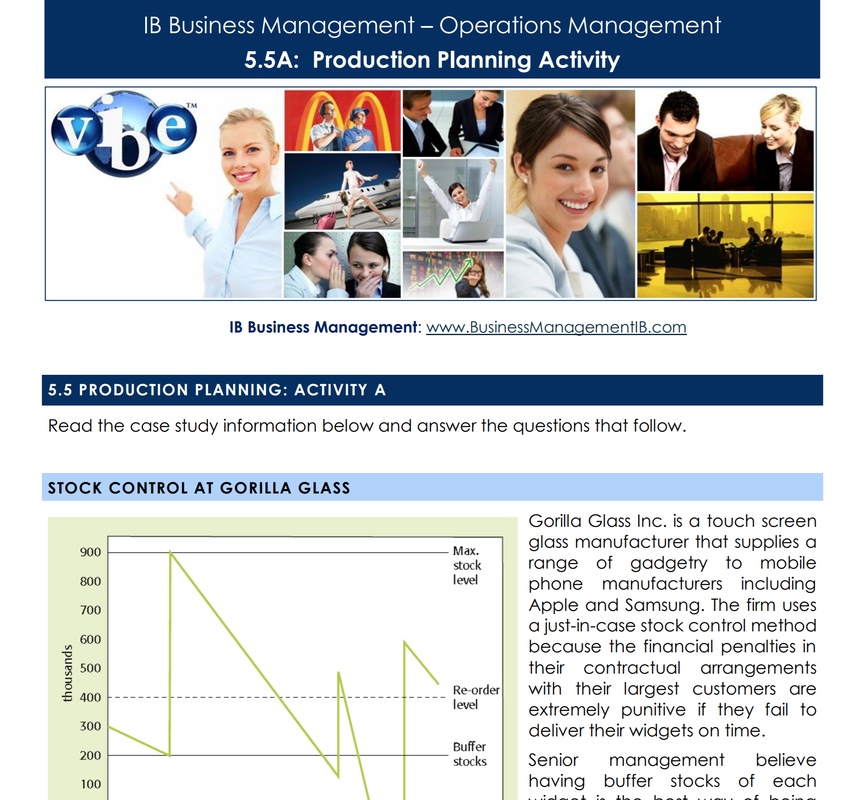
Traditional just-in-case stock-control chart
The stock level does not necessarily follow regular and consistent patterns. The strength of sales is shown in the slope of the line. Strong sales lead to stocks being quickly depleted - steeply sloping lines. Weak sales lead to stocks being slowly depleted and less steeply sloping lines. A run of unexpected sales or supply chain interruptions can lead to stock outs.
Stock control CHARTS:
|
buffer stocks protect against supply chain interuptionsThe Japanese earthquake interrupted the efficient just-in-time supply chains of major manufacturers such as Toyota and Apple.
Pros and Cons of just-in-case stock management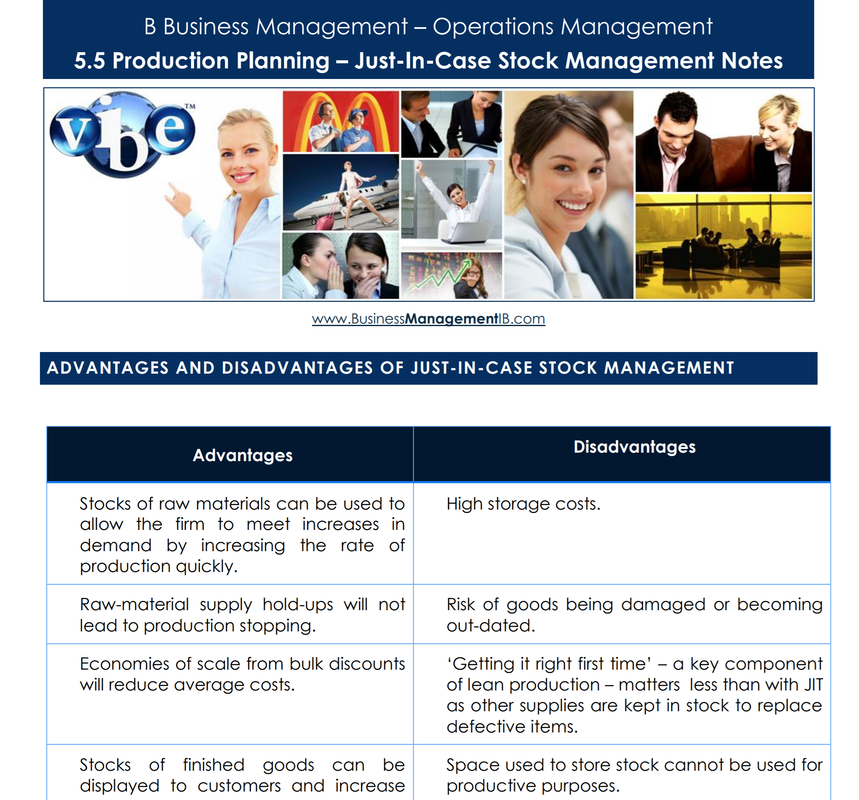


|
Stock-control and small IT systems |
Stock-control and massive IT systems |
Capacity UtilisationCapacity utilisation: the proportion of maximum output capacity currently being achieved.
There are potential drawbacks to operating at full capacity for a long period of time:
Capacity UTILIsATION - Notes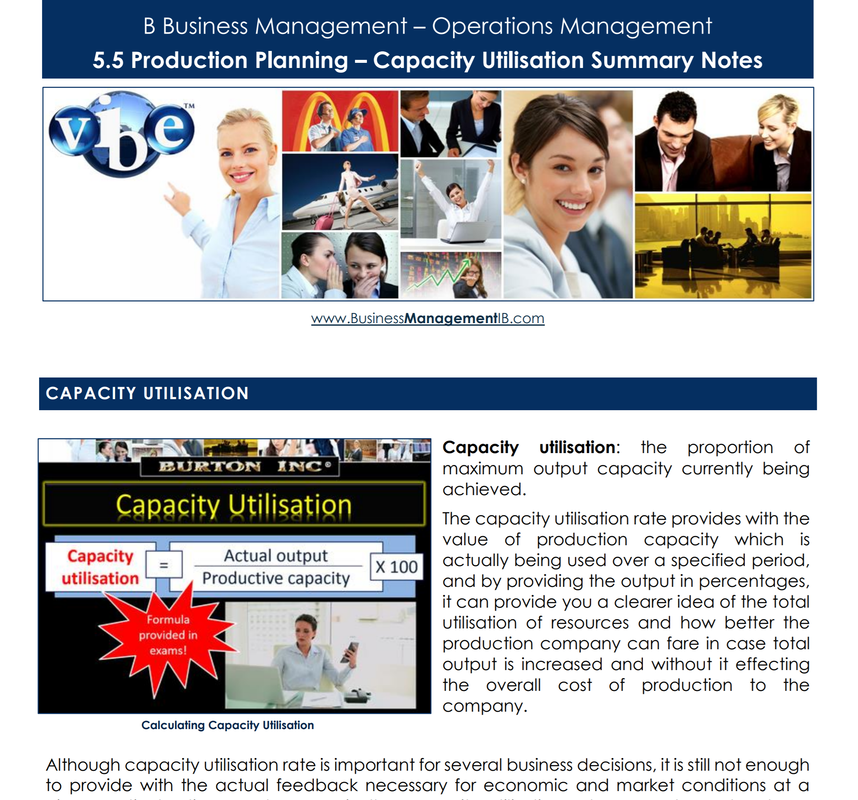

|
Calculating Capacity Utilisation
How to calculate capacity utilisation
For example, if a t-shirt manufacturer can produce a maximum of 10,000 t-shirts a month in her factory using current equipment and staffing, and is currently producing 7,000 t-shirts a month then it's capacity utilisation rate is 70 per cent.
overcoming capacity shortage:
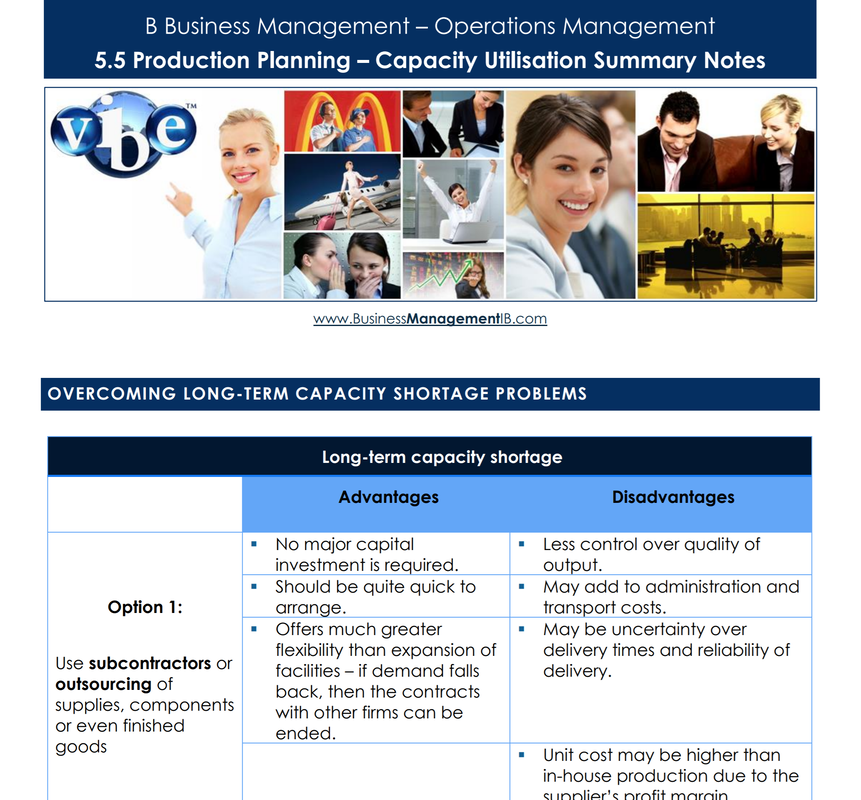


|
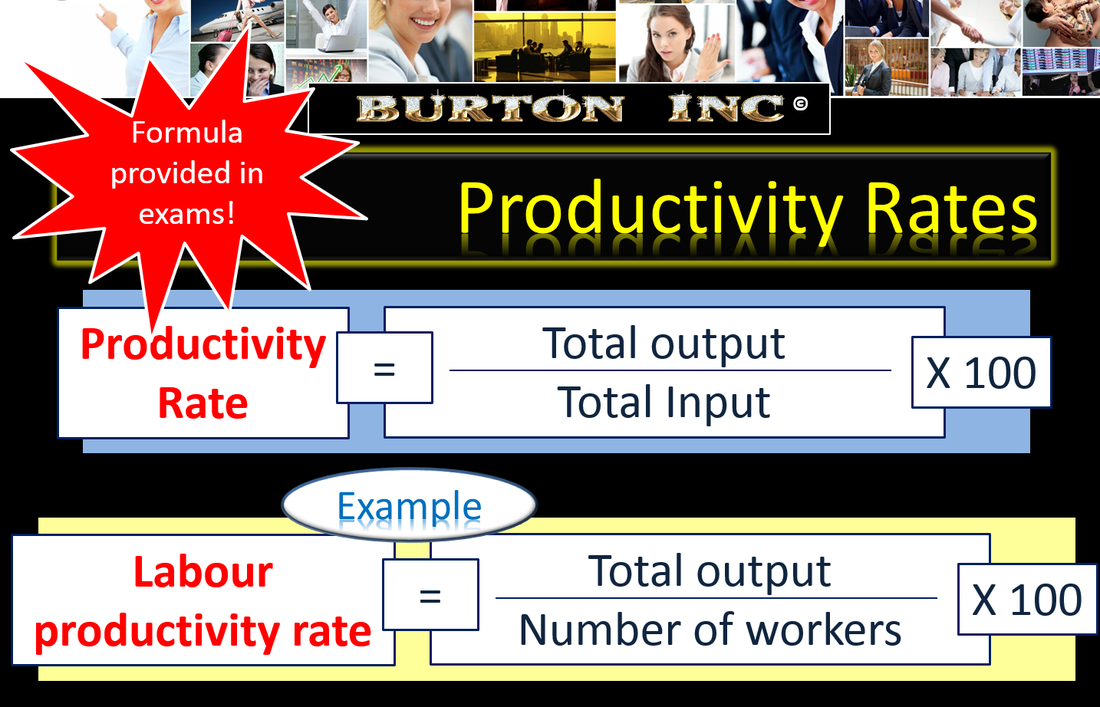
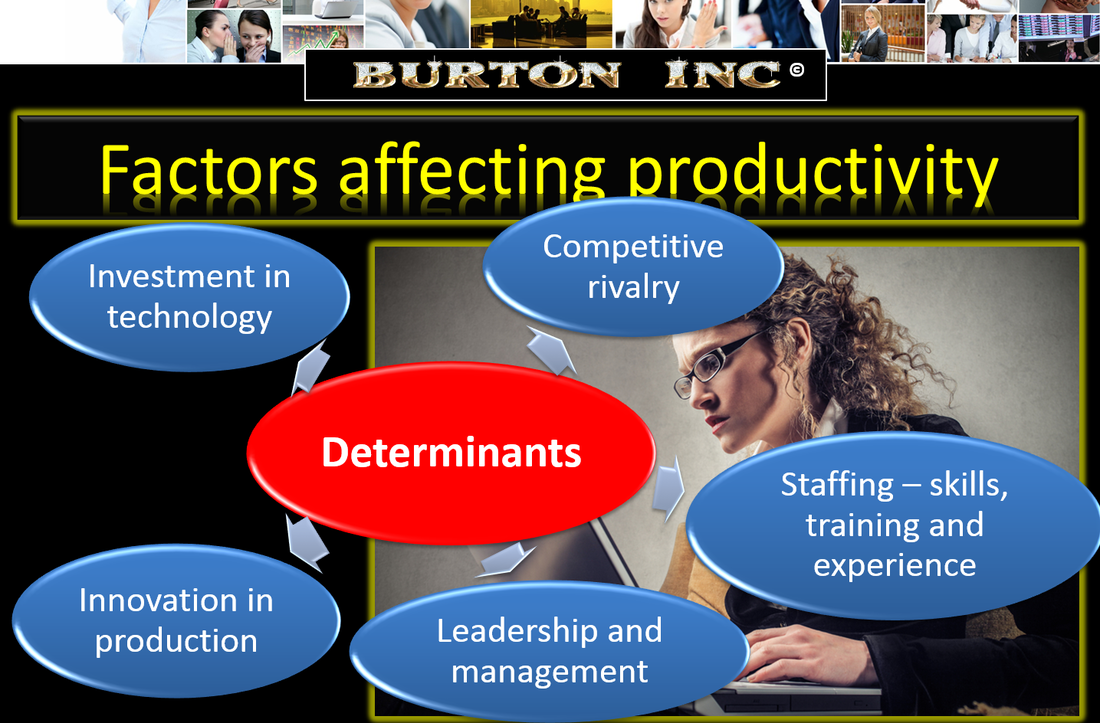
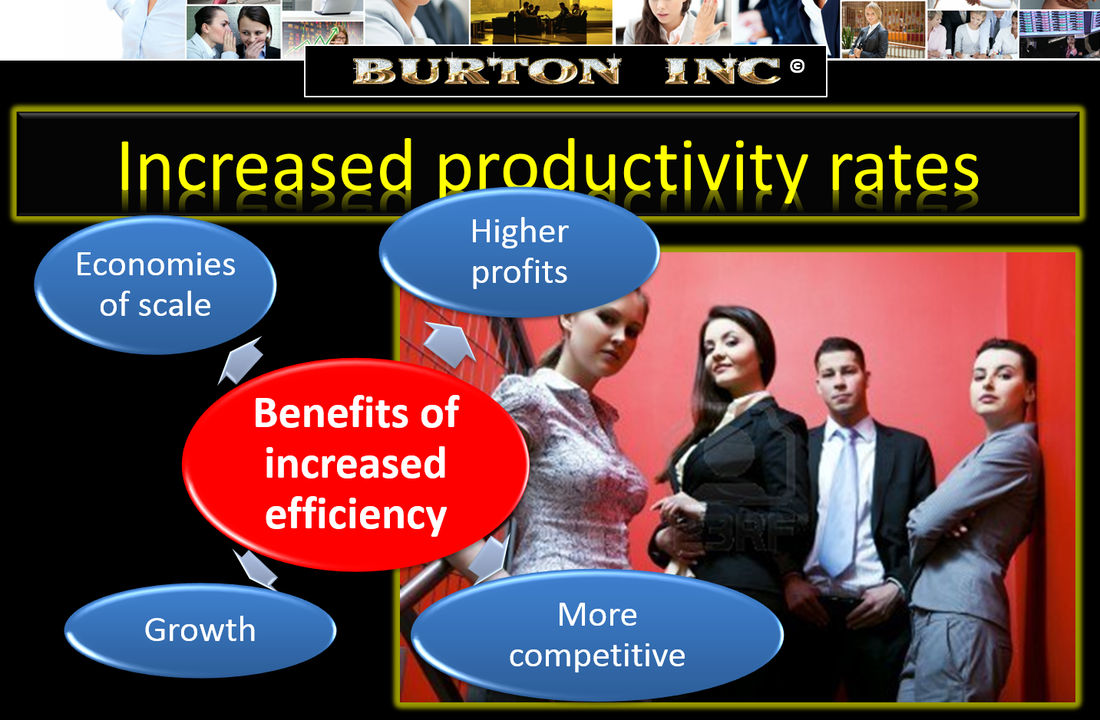
ProductivityHow well a firm is using its resources in the process of producing its goods or services is measured by its productivity rates. For example, the productivity of labour and the productivity of capital are commonly used metrics a firm would be interested in. The higher the labour productivity, the more efficient a business's use of its labour is. Staff can produce more product, or less staff can be used to produce the same amount of product. Either way, the labour cost per unit of output is reduced enabling the firm to reduce its costs of production. Higher productivity rates increase the efficiency of firms and economies of scale are achieved (increased output at reduced cost), thus enabling higher profits to be made. Increased productivity enables firms to grow.
|
Labour Productivity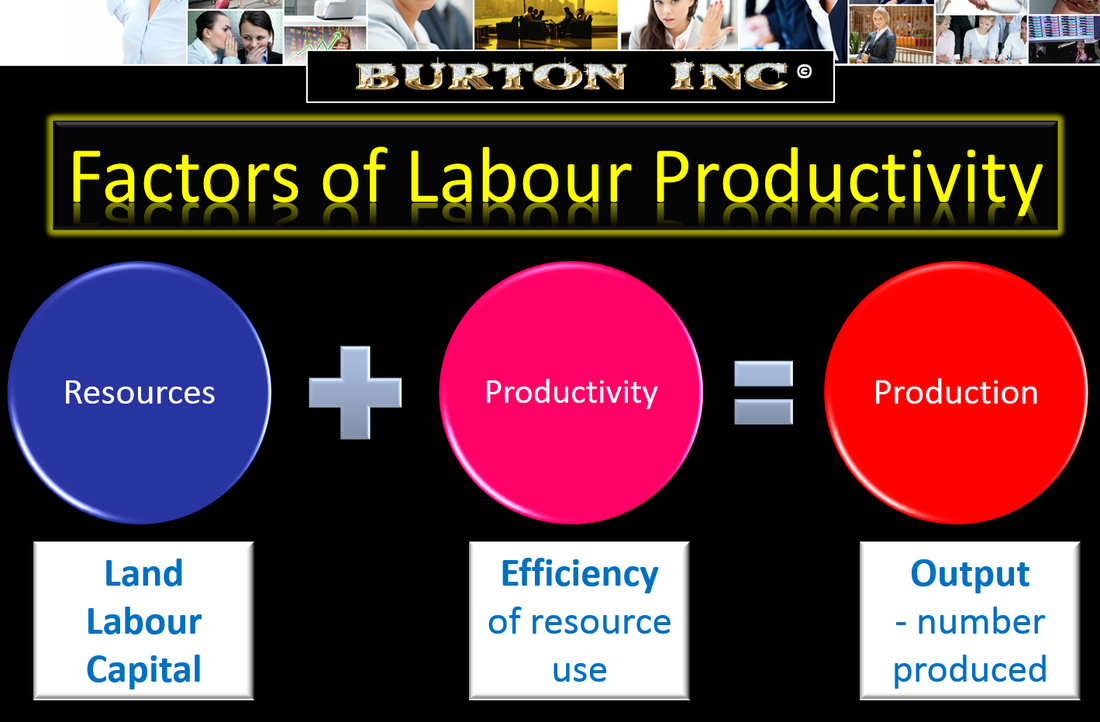
|
COst to buy and cost to makeThe potential cost advantages of outsourcing are an important part of the make-or-buy decision. The cost to buy a component or service can be obtained from estimates given by potential suppliers. The cost to make should use contribution costing, that is only the additional costs of making a product or component or providing a service should be considered. Overheads that would still have to be paid if the outsourcing option was used should not be included in the calculation. An example can be used to demonstrate this. An operations manager of a computer assembly firm has obtained an estimate from a specialist supplier of keyboards: ‘To supply 1000 keyboards each month at $3 each = total cost of $3000’.
The manager has estimated the internal variable and direct costs of making keyboards in-house at $3.50 each. Obtaining 1000 keyboards from an outsourcing company would save the computer business $500 per month. The cost to buy is less than the cost to make. 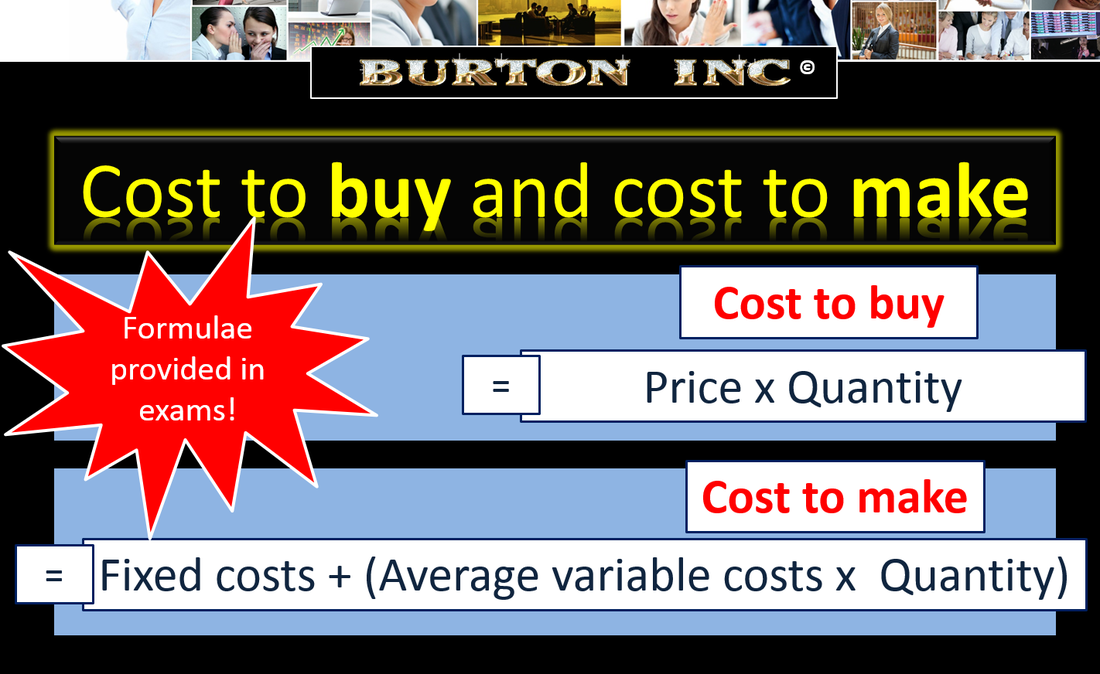
Make-or-buy? Worked Example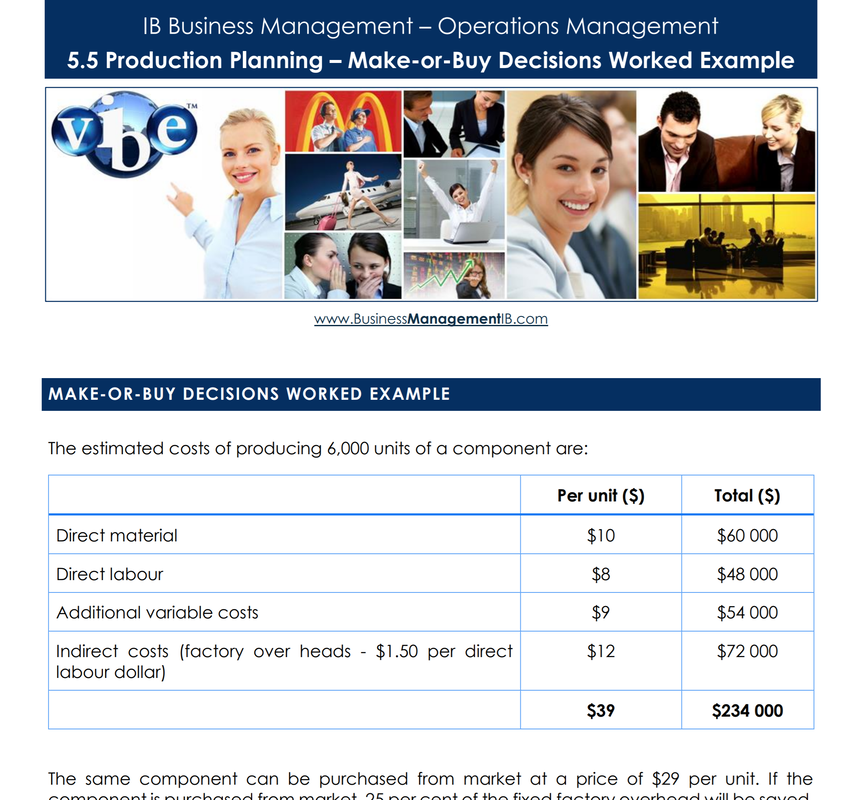

|
Make or Buy decisionsThe Make-or-Buy Decision (also called the outsourcing decision) is a judgment made by management whether to make a component internally or buy it from the market. While making the decision, both qualitative and quantitative factors must be considered.
Examples of the qualitative factors in make-or-buy decision are: control over quality of the component, reliability of suppliers, impact of the decision on suppliers and customers, etc. The quantitative factors are actually the incremental costs resulting from making or buying the component. For example: incremental production cost per unit, purchase cost per unit, production capacity available to manufacture the component, etc. Make or Buy Decisions - MakeMake or Buy Decisions - Buy
|
5.5 Production Planning:
PowerPoint summary notes

Progress check - test your understanding by completing the activities below
You have below, a range of practice activities, flash cards, exam practice questions and an online interactive self test to ensure you have complete mastery of the IB Business Management requirements for the Operations Management 5.5 Production Planning topic.
Test yourself
|
Use the Flashcards in ALL THREE STUDY MODES |


|


|

|

|

|


|


|
Habits of successful IB Students
"Don't let the fear of losing be greater than the excitement of winning." |

|